
You open your brokerage statement and see trade after trade after trade. Some names are unfamiliar. Some positions were held so briefly you barely had time to know they existed. The account may be down, flat, or producing taxable gains you never expected. Your broker tells you the activity is “part of the strategy.”
That answer isn't good enough.
If trading in your account feels excessive, the number you need to understand is the portfolio turnover rate. It tells you how frequently investments are being replaced. In a mutual fund, it helps you judge how aggressively a manager trades. In an individual brokerage account, it can help expose something more serious: churning, which is excessive trading done to generate fees or commissions rather than to help the client.
A lot of investment writing treats turnover as a dry fund statistic. That misses the point. For investors who have suffered losses, this metric can become evidence. It can show whether the trading in your account matched your objectives, or whether your account was used like a revenue machine for someone else.
Is Your Broker Trading Too Much in Your Account
You're probably here because something feels off. Maybe your account statements look busier than they should. Maybe your tax documents showed more realized gains than expected. Maybe you told your advisor you wanted steady investing, but your account reads like a trading diary.
That concern is reasonable. Frequent trading isn't automatically wrongful, but it is never something you should ignore. If your broker is buying and selling constantly, you need to know whether that activity served your interests or theirs.
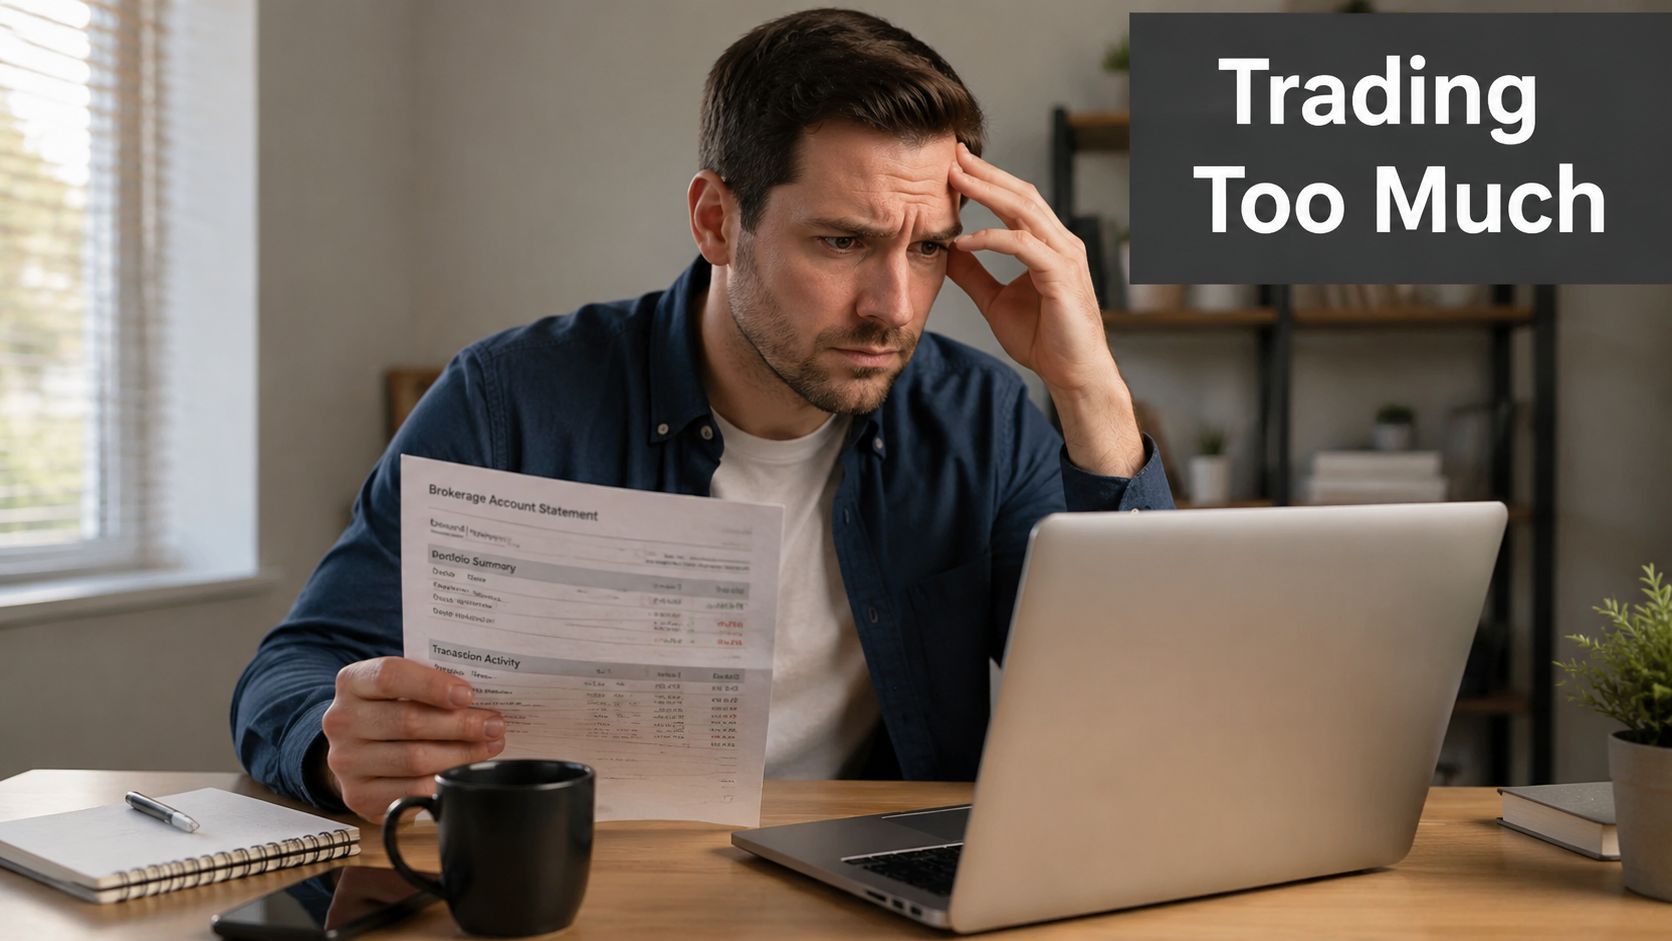
A brokerage statement can look complicated by design. If you need help reading the trade activity line by line, start with this guide to understanding a broker statement. You want to know what was bought, what was sold, when it happened, and whether that pattern makes sense for your stated goals.
What the turnover rate tells you
The portfolio turnover rate is a measure of trading frequency. At a basic level, it answers one direct question: how much of the portfolio changed over a year?
That matters because excessive trading can hurt you in ways that don't always appear in a simple performance snapshot. It can generate costs, trigger taxes, and create confusion that keeps investors from spotting misconduct until the damage is done.
Practical rule: If you can't explain why your account is trading so often, don't assume there's a good reason.
Why this metric matters in legal claims
From an attorney's perspective, turnover isn't just an investment concept. It's a forensic clue. When investors suspect churning, unsuitable trading, or unauthorized activity, turnover helps identify whether the account activity was consistent with the investor's needs.
A conservative retiree shouldn't wake up to a hyperactive account without a clear, documented explanation. If that happened to you, the turnover rate may be one of the first places to look.
Decoding the Portfolio Turnover Rate
Think of a basketball coach. Some coaches stick with the same core lineup. Others keep sending players in and out. A portfolio works the same way. A low-turnover strategy keeps most holdings in place. A high-turnover strategy swaps positions constantly.
That's the basic idea. Now the formal part.
The SEC formula
The portfolio turnover ratio is calculated as the lesser dollar value of total purchases or total sales, divided by the average dollar value of the fund's portfolio over the year, excluding securities with maturities under one year, as explained in this discussion of the SEC turnover formula and holding period meaning.
That sounds technical, but the practical meaning is simple. The number gives you a rough sense of how quickly the portfolio is changing.
The same source explains that a 100% turnover ratio indicates a one-year average holding period. It also notes that a 25% turnover ratio implies about a four-year average holding period, while a 200% ratio implies an average holding period of about six months.
How to read the number in plain English
Here's what those figures mean in practice:
- Lower turnover usually means the manager holds investments longer.
- Higher turnover usually means the manager is moving in and out of positions more aggressively.
- Very high turnover should make you ask why the strategy requires that much activity.
If you've given a broker trading authority, the answer can get more complicated. In a discretionary account, the broker may place trades without asking for approval each time. That arrangement can be legitimate, but it also removes an important checkpoint. If the account starts trading far more than expected, you may not spot the problem until months later.
The turnover rate doesn't tell you whether a broker acted lawfully. It tells you where to start asking hard questions.
Where investors usually find this information
For mutual funds, turnover is commonly disclosed in the fund's materials. For individual brokerage accounts, you often have to reconstruct the activity from statements and confirms. That's one reason so many investors miss the warning signs. The number isn't always handed to you in a neat box. Sometimes you have to build it yourself.
The True Cost of High Turnover on Your Investments
High turnover can hurt investors in three separate ways. The first is visible. The second often shows up at tax time. The third is behavioral, and it's one of the least appreciated problems in broker misconduct cases.

Trading costs are real even when they're buried
Every trade has friction. In some accounts that friction appears as commissions. In others it's buried in spreads, markups, markdowns, or product-level expenses. Investors often focus on whether the account made or lost money and miss the smaller charges attached to repeated transactions.
Those costs matter because they come out of your account, not your broker's pocket. A strategy has to overcome those costs just to break even on a net basis.
Taxes can turn moderate activity into a serious drag
Many investors get blindsided. The hidden tax and behavioral cost of moderate turnover (40–60%) is rarely explained clearly to individuals. One source notes that the average actively managed US equity fund had a 63% turnover ratio in 2019, and that this middle range creates hidden drag through tax inefficiency and churn-induced underperformance, as discussed in this overview of moderate turnover and hidden investor costs.
That point deserves emphasis. Investors often think only extreme trading is dangerous. It isn't. Moderate turnover can still generate realized gains, short holding periods, and a level of account activity that works against long-term compounding.
If your account is taxable, frequent selling can produce a painful mismatch. You may not feel richer, but you still owe taxes because someone kept realizing gains along the way.
A strategy can look acceptable before taxes and still be harmful after taxes.
Gross returns and investor outcomes are not the same thing
There's an important nuance here. A study of US-domiciled actively managed equity mutual funds from 1991 to 2020 found that turnover was highly skewed and persistent across years, but there was no reliable relationship between fund turnover and gross annual returns in any prior, same, or subsequent year, according to the SSRN paper on turnover persistence and gross returns.
That finding matters because it cuts through a common myth. High turnover doesn't automatically prove a manager is incompetent. Low turnover doesn't automatically prove superior skill. But for the investor, gross returns aren't the whole story. Taxes, fees, and transaction costs still reduce what you keep.
Behavioral damage is harder to measure and easier to ignore
Constant trading also changes investor behavior. Clients stop understanding what they own. They become dependent on the broker's explanations. They lose the ability to distinguish strategy from improvisation.
That confusion can be part of the problem, especially in accounts where the broker talks often, trades often, and leaves the client with nothing solid except paper activity. When investors can't track the logic of the trading, they're less likely to challenge it.
Portfolio Turnover Benchmarks What Is Normal
A turnover figure means very little without context. You need a baseline. Otherwise, a broker can defend almost any trading pattern by calling it “active management.”
Industry context helps. The median portfolio turnover rate for stock mutual funds in 2004 was 65%, and the asset-weighted turnover rate was 51%, while shareholders tended to invest in funds with lower-than-average turnover and often preferred buy-and-hold strategies with annual turnover below 20%, according to the Investment Company Institute's discussion of stock fund turnover patterns and investor preferences.
Typical Portfolio Turnover Rates by Investment Strategy
| Investment Strategy | Typical Annual Turnover Rate |
|---|---|
| Buy-and-hold stock fund | Below 20% |
| Broad stock mutual fund median reference point | 65% |
| Asset-weighted stock mutual fund reference point | 51% |
| Moderate-turnover actively managed equity fund | 40–60% |
| Aggressive active trading approach | Above these ranges, depending on strategy |
What this table does and does not tell you
Use these figures as guideposts, not excuses. A higher number may be normal for a specific strategy. But “normal for some product somewhere” is not the legal standard in a customer case.
The pertinent question is whether the trading matched your objectives, risk tolerance, age, liquidity needs, and investment profile. A younger investor who knowingly wants an aggressive strategy is one thing. A retiree seeking income and preservation is another.
The benchmark that matters most
If your account was supposed to be conservative, a high turnover pattern deserves scrutiny even if the broker says active funds do it all the time. On the other hand, if you specifically approved an active strategy, the analysis shifts to whether the costs, volume, and rationale still made sense.
Benchmarks provide context. Suitability provides accountability.
The Red Flag Distinguishing Active Trading from Churning
A lot of investors hear “high turnover” and assume fraud. That's too simplistic. Some strategies trade frequently by design. The legal issue isn't just activity. It's excessive activity that serves the broker more than the client.
That's churning.
Legitimate active management versus abusive trading
A legitimate active strategy has a coherent thesis. The investor understands it. The account documents support it. The trading pattern aligns with the client's goals and risk tolerance.
Churning looks different. The trades pile up, but the benefit to the client is hard to identify. The account may generate commissions or fees while the investor absorbs the risk, the tax burden, and the confusion.
If you want a quick outside reference for how markets distinguish fast, intentional speculation from ordinary investing, this explanation of defining a day trader is useful. The point isn't that every active account is improper. The point is that true trading strategies have identifiable characteristics. Many abusive accounts don't.
The warning signs that deserve investigation
One academic discussion of turnover and misconduct notes a major gap in how investors evaluate suspicious activity. It points out that investors harmed by churning often lack a framework to prove it, and that guides often fail to flag sudden jumps such as 30% to 90% as red flags for fraud or negligence, as discussed in this analysis of turnover misuse and churning red flags.
That's exactly right. The pattern matters.
Watch for these signs:
- A sudden increase in trading: If the account was relatively calm and then becomes hyperactive without a documented reason, pay attention.
- A mismatch with your objectives: A conservative income account should not behave like a speculative trading account.
- Poor explanations: If the broker uses vague language such as “rotation,” “taking advantage of opportunities,” or “being tactical,” but can't explain why the trades fit your goals, that's a problem.
- Costs without corresponding value: Heavy activity that produces little benefit for the client can support a churning claim.
Why intent is rarely admitted
Brokers rarely say, “I traded your account to generate fees.” Churning cases are usually built from patterns, documents, and economics. That includes turnover, commission history, account objectives, and who controlled the trading.
If you're unsure what qualifies legally, this overview of churning in finance gives the core concept. The key point is that excessive trading must be evaluated in context. One investor's active strategy can be another investor's abuse.
You don't need a confession to spot a churned account. You need records, consistency, and a trading pattern that doesn't make sense for the client.
Building Your Case Steps to Take If You Suspect Churning
If you suspect churning, don't start by arguing with the broker. Start by preserving evidence. These cases are won with documents, timelines, and patterns, not with vague memories of phone calls.

Gather the core documents
Collect the records that show what the broker did and what you authorized.
- Monthly account statements: These show the sequence of trades, position changes, and overall account movement.
- Trade confirmations: These can reveal how often the account was turning over and how each transaction was processed.
- New account forms and agreements: These documents matter because they usually state your investment objectives, risk tolerance, and whether the account was discretionary.
- Emails, letters, and text messages: Written communications can show what the broker promised and how the strategy was described.
- Notes from calls or meetings: Even informal notes can help establish what you were told.
Build a simple chronology
Don't overcomplicate this. Put the documents in date order and ask basic questions.
- When did the heavy trading begin?
- Did anything in your goals change at that time?
- Did the broker explain the shift in writing?
- Were the trades concentrated in certain products or repeated in a pattern?
- Did the account activity continue even when results were poor?
A chronology often exposes what investors couldn't see in real time. Looking month by month is far more effective than looking at a single annual statement.
Focus on control and consistency
A churning claim usually turns on more than raw activity. It also involves who controlled the account and whether the activity fit the customer's profile.
Review whether you were making the trade decisions yourself, or whether the broker was effectively running the account. If you approved recommendations without understanding them, that can still matter. Many investors had nominal involvement but no practical control.
Save every statement and confirmation. Missing months can hide the very pattern that proves the claim.
Don't let the broker frame the story for you
Brokers often defend suspicious activity by pointing to market conditions or saying they were being proactive. Sometimes that explanation is true. Sometimes it's cover. The documents will tell you more than the sales pitch ever will.
Your Path to Recovery Through Legal Action
Most disputes against brokerage firms aren't resolved in court. They're usually handled through FINRA arbitration. That process is formal, evidence-driven, and very different from calling a branch manager to complain.
A strong claim usually requires proof that the trading was excessive in light of the investor's objectives and that the activity caused harm. In churning cases, the analysis often centers on account control, suitability, trading frequency, and the economic benefit to the broker. You need a presentation that connects the records to a legal theory of recovery.
That's why investors should speak with counsel who understands securities cases, brokerage records, and FINRA procedure. General litigation experience isn't enough. These cases involve industry rules, account documentation, and trading analysis that many attorneys never handle.
If you're looking into next steps, start with a broker misconduct lawyer who handles investor claims. A focused review can tell you whether the turnover in your account reflects strategy, negligence, or something worse.
If you would like a free consultation to discuss the investment loss recovery process in more detail, call Kons Law Firm at (860) 920-5181 for a FREE, NO OBLIGATION consultation.
If you think excessive trading damaged your account, Kons Law can evaluate the records, explain whether the activity may support a claim, and help you pursue recovery through FINRA arbitration or other appropriate legal action.
